
Produced by: Alexanne Penton
Portfolio Introduction
Mission Statement
The following portfolio is designed to better understand the economic progress of Wilmington, NC compared with competing cities in the southeast, focusing on Charleston, SC and Savannah, GA.
About the Portfolio
The data selected for the portfolio comes from multiple sources to provide well-balanced information and accurate statistics. The reason to compare Charleston and Savannah with Wilmington, NC is because of several key factors. Both of these cities are viewed as “peer cities” to Wilmington due to the population size and economic assets, including tourism, seaports, working river, and coastal location. The data for each city, Wilmington, Charleston, and Savannah, is organized by metropolitan statistical area (MSA) and viewed over a ten-year period, from 2006 to 2016. The variables compared among the cities are designed to give a concise, yet effective, understanding of regional economic health.
Key Takeaways
The report is divided into five sectors, each including economic variables; economic development indicators, quality of place, entrepreneurial environment, human capital, and innovative activity.
Guiding Questions
- What is the size of the metropolitan area’s economy?
- Is the metropolitan area’s economy growing or declining? Is there a discernable trend over time?
- What industries are driving a metropolitan area’s economic growth?
- How does the growth of one metropolitan area’s economy compare with the growth of other metropolitan areas, the state, and the nation?
Collected Data
Economic Indicators
This set of indicators includes personal income, per capita personal income, GDP, total employment, population, average job earnings, and new construction rates.
The following four graphs compare each region, as well as how they rank to the nation. The numbers per region are based on a national average of 100.
Data Analysis
Economic Indicators
When looking at the selected economic indicators for the Wilmington, Charleston, and Savannah MSAs, at a glance, they demonstrate regional economic health.
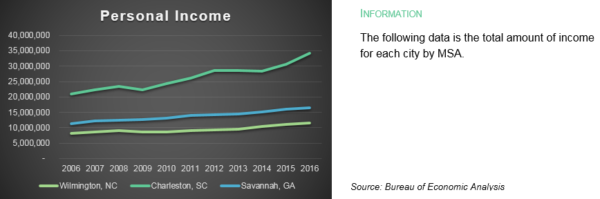
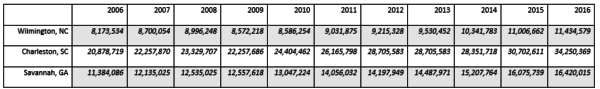
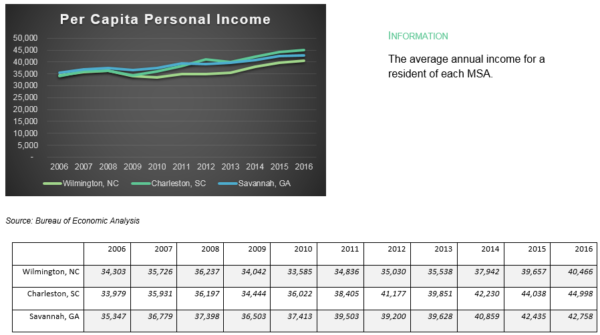
Personal Income and Per Capita
The personal income for each MSA is spread out, with Charleston annually having a drastically higher income than both Wilmington and Savannah. The per capita personal income, however, is much closer. In 2006, the per capita was annually within two thousand dollars between the three regions. Then again, in 2016, the per capita personal income was back within four thousand dollars between the regions; the smallest difference in ten years indicates the economy has peaked since the Recession (2008).
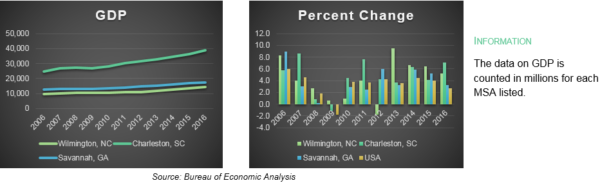
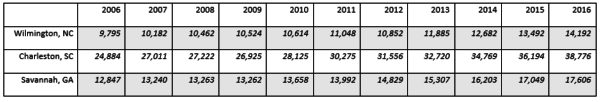
GDP
The data shows that Charleston has a much higher GDP than both Wilmington and Savannah, and the region’s GDP has had a more rapid rate of growth over 10 years. Wilmington and Savannah have nearly parallel growth grates for GDP, yet Savannah’s GDP hovers around 4 million USD higher than Wilmington. Each of the regions not only maintained but increased their GDP from 2008 to 2012.
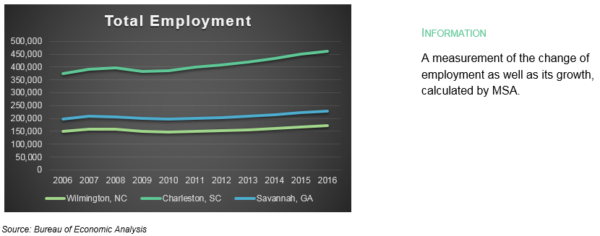
Total Employment
Additionally, employment for Wilmington and Savannah followed a similar rate of increase to GDP. Savannah maintains a steady 50,000 more employed persons than Wilmington. When looking at the Recession (2008) and how each region performed and recovered, Charleston experienced a delayed start of unemployment. Even so, the region’s unemployment rates remained severely higher during the period compared to Wilmington and Savannah. Nevertheless, their recovery was rapid, prompting a large amount of growth.
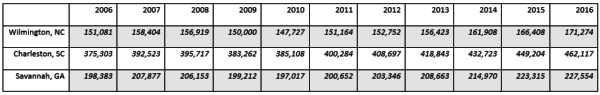
Population
There has been steady growth in population in the MSA areas from 2006 to 2016. Of these regions, Charleston has been the fastest growing, and although it has been the most populated city among the compared regions. Unemployment rates are much higher than Wilmington and Savannah. The Wilmington MSA, in fact, has the lowest unemployment rate between the regions.
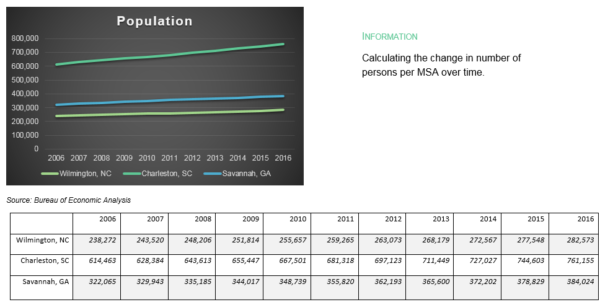
Labor Capacity
By dividing the total employment by total population, the dividend indicates labor capacity. Once computed to a percentage, the labor capacities of Wilmington, Charleston, and Savannah were compared to the nation. On average, from 2006 to 2016, Wilmington maintained a labor capacity higher than the United States. Ranging from 58.0 to 65.1 percent capacity, the Wilmington MSA holds a more secure workforce, which may lead to a higher chance of economic success and growth.
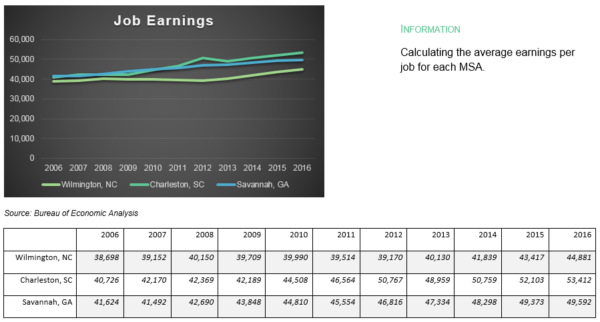
Job Earnings
Similar to the per capita personal income, job earnings were very close to the other three regions in 2006 and once again in 2016. During the Recession (2008), earnings varied, but in 2012, as the economy corrected, they were the farthest apart they would be over the ten-year period. In 2012, Charleston would hit a peak in job earnings. It would be fair to say that this rapid spike is due to large manufacturers moving to the area, such as the Boeing plant which is one of two 787 Dreamliner assembly and delivery facilities in the United States.
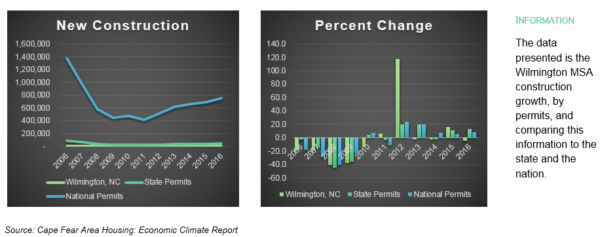
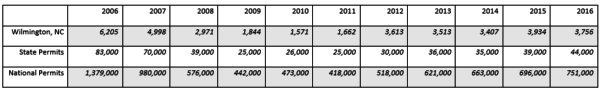
New Construction (Wilmington)
Construction has rebounded since the recession. New construction rates, in this report, are compared to the state and the nation, rather than regions, and focus on the progress of Wilmington. Our MSA has maintained a similar growth ratio, relative to the state and the country. Although the United States economy has hit a high since the Recession (2008), the construction numbers from 2006 to 2016 offer insight to the validation of this statement. In 2016, regional, state, and national new construction was half of where it stood ten years prior. This indicates that this might be due to a labor shortage after the hard toll the recession had on many developers beginning in 2008. Even though the housing demand is up, and the economy is thriving, the Recession eliminated a healthy percentage of developers.
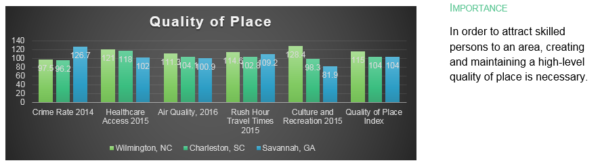
Quality of Place
Examining the location and community quality among Wilmington, Charleston, and Savannah, our region places near the top with a Quality of Place Index of 115. This means that we are fifteen points above the national average of 100 and have gained six points since 2010. Our community prides ourselves on the atmosphere that we have created, looking to not only sustain, but to strive to be an even better place.
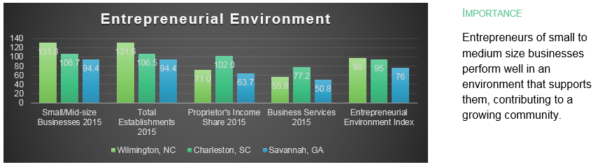
Entrepreneurial Environment
The Wilmington MSA maintains an Entrepreneurial Environment Index higher than that of Charleston and Savannah holding a score of 98. Even though our region has lost two points since 2010, we remain close to the national average. Wilmington has outperformed regional competitors with a high number of small to mid-size businesses and the high number of establishments. Interestingly, business proprietor’s income share is trending lower. This is due to the large quantity of smaller businesses, and not national credit quality businesses.
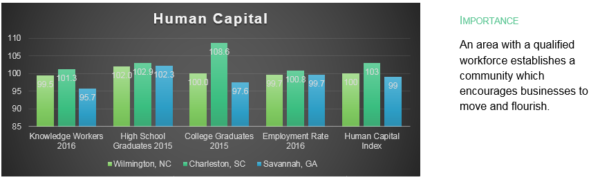
Human Capital
The Human Capital Index for the Wilmington region is at the national average, 100; but, since 2010, it has dropped nine points. Relative to the nation, our MSA is generally performing well. The Wilmington high school graduate rate is lower than Charleston and Savannah, likely having an impact on our lower employment rate. The region has a higher demand for workers with more advanced job skills.
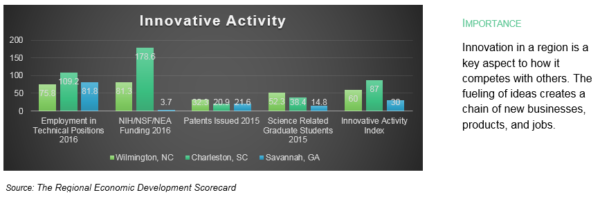
Innovative Activity
Surprisingly, all of the regions are very low in “innovation” compared to the nation. Wilmington, with an Innovative Activity Index of 60, has dropped a shocking nineteen points since 2010. There are perhaps two reasons for this. First, Wilmington has demonstrated a large amount of small to mid-size businesses, but few in the fields of computer, science, and engineering occupations. Secondly, lower graduation rates limit the innovative capability of a region. It would be hard to determine if the Wilmington MSA could ever be at or above the national average.
Summary
In conclusion, from the previous Data Analysis, certain statements can be made about the Wilmington economy, relative to Charleston, Savannah, and the nation. Without a doubt, the Wilmington MSA economy has been growing at a slow, but steady rate. Wilmington’s economy relies on the influx of small to mid-size businesses. Charleston and Savannah have landed centers of larger businesses, yet the effects are not clearly measurable.
Wilmington’s economic growth is fueled by many aspects of a well-balanced community. As indicated in the Data Analysis, our city maintains an impressive quality of place, entrepreneurial environment, and human capital. These rankings not only meet, but exceed, the national average, and tops Charleston and Savannah. Although innovative activity is low in the Wilmington MSA, Charleston and Savannah face similar challenges.
Even though general economic indicators such as personal income, GDP, employment, population, and job earnings for Wilmington are lower than the two compared cities, quality of place, entrepreneurial environment, human capital, and innovative activity scored much higher. These broader economic indicators provide a deeper understanding of what a community needs to encourage economic growth.
Methodology Credits and Citations
Bureau of Economic Analysis
“The calculation [of] the GDP by metropolitan area statistics starts by creating current-dollar statistics for each industry in each metropolitan area. Price information from BEA’s industry accounts are then used to adjust these statistics to account for price differences when making comparisons of GDP by metropolitan across time and to calculate industry contributions to growth within a metropolitan area.” [1]
Wilmington Regional Economic Scorecard
“The Regional Economic Development Scorecard was created in 2015 by the Wilmington Chamber’s flagship initiative, Cape Fear Future, to provide a baseline to develop goals that will encourage economic progress. The Scorecard is an objective depiction of where our region stands against peer cities that compete with us for skilled workers, new businesses and entrepreneurs. This 3rd Annual Scorecard contains data from key areas of economic development: human capital, innovation, entrepreneurship, quality of place and traded sector. The research, conducted by Dr. Adam Jones and UNCW’s Swain Center, reflects data collected for Brunswick, New Hanover and Pender Counties.” [2]
Cape Fear Area Housing
“The Wilmington-Cape Fear Home Builders Association represents and industry that contributes billions of dollars to the economy of Southeastern North Carolina and supports thousands of jobs in the greater Wilmington area. For more than 50 years, the WCFHBA has been the voice of the building industry, working to support not only our members involved in the home building industry, but also be an influential force for responsible growth by protecting property rights and the privilege of home ownership.” [3]
[1] GDP by Metropolitan Area Methodology, (Bureau of Economic Analysis, 2015).
[2] Wilmington Chamber of Commerce, Wilmington Regional Economic Scorecard, (Cape Fear Future, 2017).
[3] Cape Fear Realtors, Wilmington-Cape Fear Home Builders Association, Economic Climate Report, (Cape Fear Area Housing, 2017).
Bureau of Economic Analysis. “GDP by Metropolitan Area Methodology.” Accessed July 20, 2018.
Bureau of Economic Analysis. “Regional Data.” Accessed July 20, 2018.
Bureau of Economic Analysis. “Regional Economic Accounts Directorate: Potential Uses of BEA’s Statistics of GDP by Metropolitan Area.” Accessed July 20, 2018.
Cape Fear Realtors, Wilmington-Cape Fear Home Builders Association. “Cape Fear Area Housing: Economic Climate Report 2017.” Accessed July 20, 2018.
Wilmington Chamber of Commerce, Cape Fear Future. “Wilmington Regional Economic Scorecard.” Accessed July 20, 2018.